ALERT!
This site is not optimized for Internet Explorer 8 (or older).
Please upgrade to a newer version of Internet Explorer or use an alternate browser such as Chrome or Firefox.
Visualization Of Lung Sounds With Vibration Response Imaging (VRI™): Technical And Clinical Aspects
The desire for an objective method to record, quantify, and store lung sound information was the impetus for development of the field of computer-assisted mapping of lung sounds. Techniques are constantly evolving, with many different types of sensors, sensor coupling methods, and digital signal processing techniques in existence.
Introduction
The desire for an objective method to record, quantify, and store lung sound information was the impetus for development of the field of computer-assisted mapping of lung sounds. Techniques are constantly evolving, with many different types of sensors, sensor coupling methods, and digital signal processing techniques in existence [1-7]. The vibration response imaging (VRI™) technique was developed in order to simultaneously process multi-sensor signals from lung sound recordings and to generate a dynamic representation of breath sound distribution using gray-scale coding [8]. The dynamic nature of the image, which provides detailed information about breath sound timing between the different lung locations and quantification of regional distribution of breath sounds, broadens the lung sound information gleaned from conventional auscultation.
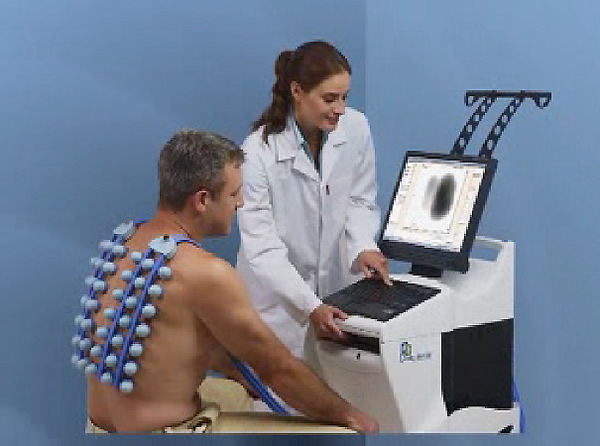
Figure 1: A PC-controlled, low vacuum system maintains constant and simultaneous attachment of 40 active piezoelectric contact sensors and 2 inactive contact sensors (left and right peripheries of the first row) to the posterior chest.
Technical aspects of the equipment
Turbulent air and vibrations within the lungs and airways are transmitted to the skin, after filtering by the lungs and chest wall [3, 6], and are captured by the multi-sensors of the VRIxp™ System (Deep Breeze™, Or-Akiva, Israel). Forty active piezoelectric contact sensors and two inactive contact sensors (left and right peripheries of the first row) (Meditron ASA, Oslo, Norway) with a linear frequency response of ±2db in the frequency range of 50Hz to 400Hz are assembled on two planar arrays (Figure 1). The arrays are attached to the posterior chest by an open system with a PC-controlled low vacuum to maintain a constant mechanical load on the sensors.
The recording process is quick, requires minimal patient effort, and is appropriate for the pediatric population as well as the adult population. Patients are seated in a quiet environment and are recorded during 12 seconds of deep breathing without forced exhalations. Lung sound signals are transferred to a computer and are analyzed by the VRI software. The signals are processed by band-pass filtering with different frequency ranges: 100-250Hz for capturing breath sounds while filtering heart sounds and chest-wall movement [4, 9], 350-850Hz for crackles, and 100-2,000Hz for wheezes. The filtered signals are then combined and sliced over regular time intervals (0.17 sec) and converted to a sequence of dynamic images that reflect regional vibration properties along time. The computer measures the maximum vibration energy during inspiration (this frame is referred to as the maximal energy frame) and uses this value for normalization of the image (Figure 2). Accordingly, the lung vibration energy will be depicted as various shades within the 256 hues from black in high data areas to white in the minimum data area.
The resulting sound or vibration energy can also be analyzed regionally for upper (top 2 rows of sensors), middle (3 rows of sensors), and lower zones (bottom 2 rows of sensors) for both the right and left lung and presented in a table (Figure 3). Presumably, both the regional quantification of breath sounds and the dynamic image are affected by changes in frequency, intensity, space, and timing of airflow and, therefore, can provide useful clinical information regarding lung condition.
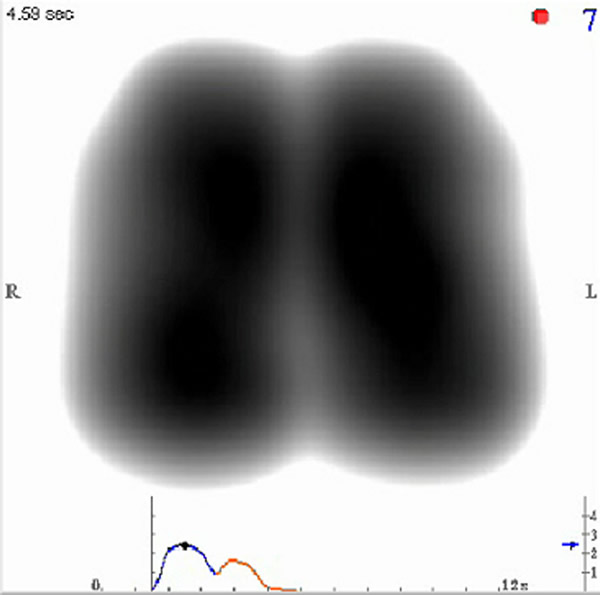
Figure 2: Maximal energy frame of a healthy 30-year-old male (lifetime non-smoker; body mass index of 25.5) shows similar contour and gray-scale energy distribution in the left and right lungs. The graph below the image shows an inspiratory phase (waveform with dot corresponds with the MEF shown) and an expiratory phase (second waveform) with higher vibration energy during inspiration.
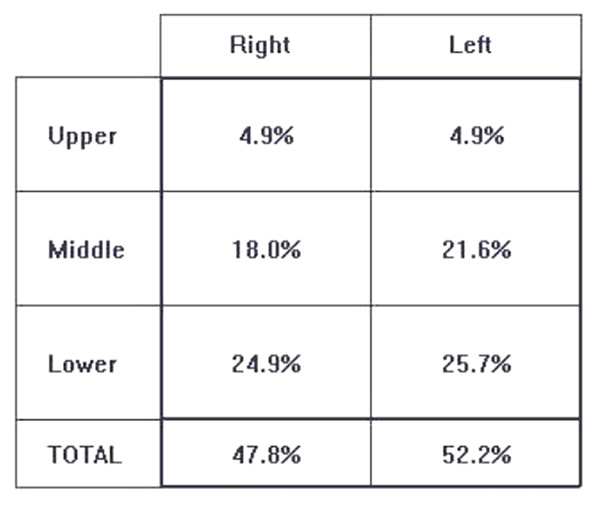
Figure 3: Quantitative assessment of breath sound distribution in the same healthy subject depicted in Figure 2, shown as a table of percentages. Vibration energy is concentrated primarily in the middle and lower regions with less energy in the upper lung fields.
Clinical use and results
The VRIxp™ System has been used for investigational purposes in medical centers in the USA, Europe, and Israel. Clinical investigations are ongoing in a number of areas, including repeatability and reliability of VRI™ in normal subjects, assessing regional lung function in populations such as asthma, emphysema, interventional pulmonology, and lung transplant patients, and pediatric studies.
A recent report [10] describes use of VRI™ to objectively evaluate the differences in regional lung vibration during different modes of mechanical ventilation in the intensive care setting. The investigators demonstrated that VRI™ offers information that is beyond what is available from existing technologies regarding the intensity and distribution of vibration within the lungs in real-time.
Preliminary results from a pilot study conducted at Beth Israel Deaconess Medical Center in Boston are promising regarding agreement between VRI™ and chest radiograph in the diagnosis of pleural effusion. Qualitative analysis showed 92% agreement for effusion location and 75% agreement for effusion size between VRI and chest radiograph. In quantitative analysis, VRI™ and chest radiograph demonstrated high correlations in both the affected hemithorax (r = -0.87) and the affected region (r = -0.82). Figures 4A and 4B show before and after drainage VRI™ images of a large pleural effusion in the right lung and a minimal pleural effusion in the left lung.
VRI patterns have been evaluated in 32 patients prior to and following bronchoscopic interventions (dilation, laser treatment, stent, etc). Eight healthy subjects were also observed. Significantly different patterns were observed among the healthy population and the patients prior to intervention. The patterns differed depending on the site and nature of the pathology and changed significantly towards a normal pattern after intervention. The VRI could be applied successfully even in patients who were too incapacitated to undergo examination by lung function testing and radiology. In up to 90% it was possible to localize the site and the nature of the lesion, even in cases in which conventional methods failed. Also, in most cases these changes could be quantified with complex algorithms to objectify the results of interventions. Figures 5A and 5B show VRI™ images before and after intervention.
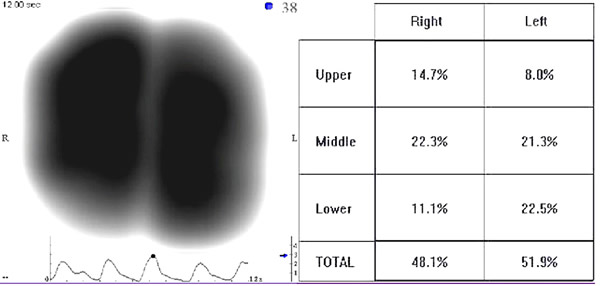
Figure 5A: VRI image of a 70-year-old male who underwent right upper lobe sleeve resection for non-small cell lung cancer with anastomosis between intermediate and right main bronchus. Complications with healing resulted in recurrent strictures at the site of the anastomosis with dyspnea. Quantitative analysis showed that the right lung contributed to 28% of the total vibration energy.
Figure 5B: Following balloon dilation and laser incision, the VRI shows an increase in vibration energy to the right lung (48% of the total energy) and a nearly normal distribution pattern.
Conclusion
VRI™ provides a new perspective in acoustic imaging and quantification of breath sounds for lung sound analysis beyond the stethoscope. Studies are required to establish the clinical utility of VRI™ and determine practical applications for the device.
References
- Earis JE, Cheetham BMG: Current methods used for computerized respiratory sound analysis. Eur Respir Rev 2000;10:586-590.
- Pasterkamp H, Kraman SS, DeFrain PD, Wodicka GR: Measurement of respiratory acoustical signals. Comparison of sensors. Chest 1993;104:1518-1525.
- Pasterkamp H, Kraman SS, Wodicka GR: Respiratory sounds. Advances beyond the stethoscope. Am J Respir Crit Care Med 1997;156:974-987.
- Kompis M, Pasterkamp H, Wodicka GR: Acoustic imaging of the human chest. Chest 2001;120:1309-1321.
- Charleston-Villalobos S, Cortes-Rubiano S, Gonzalez-Camarena R, Chi-Lem G, Aljama-Corrales T: Respiratory acoustic thoracic imaging (RATHI): assessing deterministic interpolation techniques. Med Biol Eng Comput 2004;42:618-626.
- Sovijarvi ARA, Malmberg LP, Charbonneau G, Vanderschoot J, Dalmasso F, Sacco C, Rossi M, Earis JE: Characteristics of breath sounds and adventitious respiratory sounds. Eur Resp Rev 2000;10:591- 596.
- Murphy RL, Vyshedskiy A, Power-Charnitsky VA, Bana DS, Marinelli PM, Wong-Tse A, Paciej R: Automated lung sound analysis in patients with pneumonia. Respir Care 2004;49:1490-1497.
- Dellinger RP, Parrillo JE, Kushnir A, Rossi M, Kushnir I. Dynamic visualization of lung sounds with a vibration response device: A case series. Respiration. In press 2007.
- Ploy-Song-Sang Y, Martin RR, Ross WR, Loudon RG, Macklem PT: Breath sounds and regional ventilation. Am Rev Respir Dis 1977;116:187-199.
- Dellinger RP, Jean S, Cinel I, Tay C, Rajanala S, Glickman YA, Parrillo JE. Regional distribution of acoustic-based lung vibration as a function of mechanical ventilation mode. Crit Care. In press 2007.


